1 Review for Exam 1
1.1 Key Concepts: define or contrast and compare
1.1.1 Chapter 1
- Three key economic ideas
- Efficiency vs Equality
- Technical vs Allocative efficiency
- Positive vs Normative Analysis
- Types of Economies
- Role of economic models
- Micro vs. Macro
1.1.2 Chapter 2
- Production Possibilities Frontier (PPF)
- Opportunity Cost
- Comparative advantage vs Absolute advantage
- Complete specialization
- Gains from trade
- Market system
- Circular flow diagram
1.1.3 Chapter 3:
- Perfectly competitive markets
- Law of Demand / Law of Supply
- Supply and Demand curves vs. quantity supplied and quantity demanded.
- Supply and Demand schedules
- Effect of change in price – change in quantity supplied/demanded.
- Factors that shift Demand (external factors of Demand)
- Factors that shift Supply (external factors of Supply)
- Substitute vs compliment and normal vs inferior
- Equilibrium – identifying and interpreting
- Interpreting shifts and double shifts
1.2 Problems (Multiple Choice)
- Which of the following best describes absolute advantage?
- A curve showing the maximum attainable combination of two goods that can be produced with available resources and current technology.
- The highest-valued alternative that must be given up to engage in an activity.
- The ability of an individual, a firm, or a country to produce more of a good or service than competitors, using the same amount of resources.
- The study of the choices people make to attain their goals, given their scarce resources.
- A point outside the Production Possibilities Frontier (PPF) is
- Efficient, but not feasible.
- Feasible, but not efficient.
- Both feasible and efficient
- Neither efficient nor feasible
- Which of the following best describes the Law of Demand?
- The amount of a good or service that a consumer is willing and able to purchase at a given price.
- A curve that shows the relationship between the price of a product and the quantity of the product demanded.
- The demand by all the consumers of a given good or service.
- As the price of a good or service falls, the quantity demanded of the good or service will increase.
- Economics is best defined as the study of
- how society manages its scarce resources.
- how to run a business most profitably.
- how to predict inflation, unemployment, and stock prices.
- how the government can stop the harm from unchecked self-interest.
- Your opportunity cost of going on vacation is
- the price of your airline ticket and lodging
- the lost wages from missing work
- the total expenditure needed to go on vacation plus your lost wages from not working
- zero, as long as you value the vacation as much as your wages from working
- Which of the following would shift the demand curve for gasoline to the right?
- A decrease in the price of the gasoline
- An increase in the consumer income, assuming gasoline is a normal good
- An increase in the price of cars, a complement of gasoline
- A decrease in the expected future price of gasoline
- Microeconomics is best defined as
- the study of economy-wide phenomena, including inflation, unemployment, and economic growth
- the study of how individuals, households and firms make decisions and how they interact in markets.
- claims that attempt to prescribe how the world should be.
- claims that attempt to describe the world as it is.
1.3 Worksheet
- Consider the following scenario: Saudi Arabia and the United States each have 100 worker hours per week to produce oil, corn, or a combination of both. The following table shows their production possibilities:
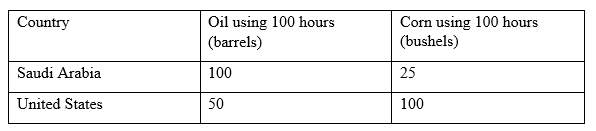
- What is Saudi Arabia’s opportunity cost of producing 1 barrel of oil? _______. 1 bushel of corn? ___________
- What is the United States’ opportunity cost of producing 1 barrel of oil? _______. 1 bushel of corn? ___________
- Who has the absolute advantage in oil production? ___________
- Who has the absolute advantage in corn production? ___________
- Who has the comparative advantage in oil production? ___________
- Who has the comparative advantage in corn production? ___________
Use the information from Question 1. Graph the Production Possibilities Frontier for both countries.
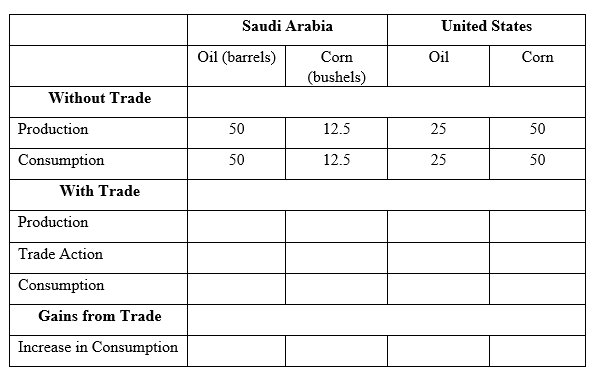
Fill in the following table assuming complete specialization and a trade action of: Saudi Arabia trades 45 barrels of oil for 40 bushels of corn.
- Graph the supply and demand curves using the following supply and demand schedule. Label the equilibrium price and quantity.
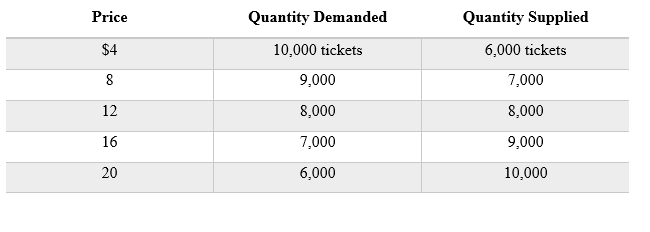
- Answer if there is shortage or surplus at each price of the good
- Effect of Shift of Demand and Supply on Eq’m Price and Quantity
Each of the events listed below has an impact on the market for smartphones. For each event, identify which curve is affected (supply or demand or both for smartphones), the direction in which it shifts, and the resulting impact on the equilibrium price and quantity of smartphones.
- The price of tablets increases.
- Consumers’ incomes decrease, and smartphones are a normal good.
- The price of semiconductor chips used to manufacture smartphones increases.
- A new social trend increases consumers’ preference for smartphones.
- Consumers expect the price of smartphones to fall in the future.
- A technological advance in the manufacture of smartphones occurs.
- The prices of smartphone cases and wireless earbuds are reduced.