| Lemonade in Pitchers | Pizza | Lemonade in Pitchers | Pizza | |
|---|---|---|---|---|
| Production & Consumption without Trade | 200 | 100 | 180 | 180 |
| Production with trade | 400 | 0 | 0 | 360 |
| Trade Action | a | b | c | d |
| Consumption with trade | e | f | g | h |
| Gains from trade | i | j | k | l |
1 Review for Exam 1
1.1 Key Concepts: define or contrast and compare
1.1.1 Chapter 1
- Three key economic ideas
- Efficiency vs Equality
- Technical vs Allocative efficiency
- Positive vs Normative Analysis
- Types of Economies
- Role of economic models
- Micro vs. Macro
1.1.2 Chapter 2
- Production Possibilities Frontier (PPF)
- Opportunity Cost
- Comparative advantage vs Absolute advantage
- Complete specialization
- Gains from trade
- Market system
- Circular flow diagram
1.1.3 Chapter 3
- Perfectly competitive markets
- Law of Demand / Law of Supply
- Supply and Demand curves vs. quantity supplied and quantity demanded.
- Supply and Demand schedules
- Effect of change in price – change in quantity supplied/demanded.
- Factors that shift Demand (external factors of Demand)
- Factors that shift Supply (external factors of Supply)
- Substitute vs compliment and normal vs inferior
- Equilibrium – identifying and interpreting
- Interpreting shifts and double shifts
1.2 Sample Multiple Choice questions
Loading practice questions …
1.3 Worksheet
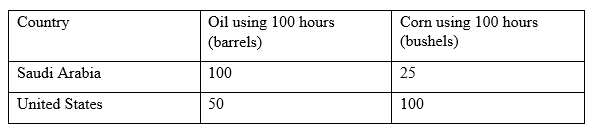
- Consider the following scenario: Saudi Arabia and the United States each have 100 worker hours per week to produce oil, corn, or a combination of both. The following table shows their production possibilities:
- What is Saudi Arabia’s opportunity cost of producing: 1 barrel of oil? _______
1 bushel of corn? ______ - What is the United States’ opportunity cost of producing: 1 barrel of oil? _______ 1 bushel of corn? ______
- Who has the absolute advantage in oil production? ___________
- Who has the absolute advantage in corn production? ___________
- Who has the comparative advantage in oil production? ___________
- Who has the comparative advantage in corn production? ___________
- Use the information from Question 1. Graph the Production Possibilities Frontier for both countries.
Answer Key
With oil on the x-axis and corn on the y-axis, Saudi Arabia’s PPF has an x-intercept of 100 and a y-intercept of 25. The United States’ PPF has an x-intercept of 50 and a y-intercept of 100. Both PPFs are linear, assuming that the opportunity cost is constant at every point along each PPF.
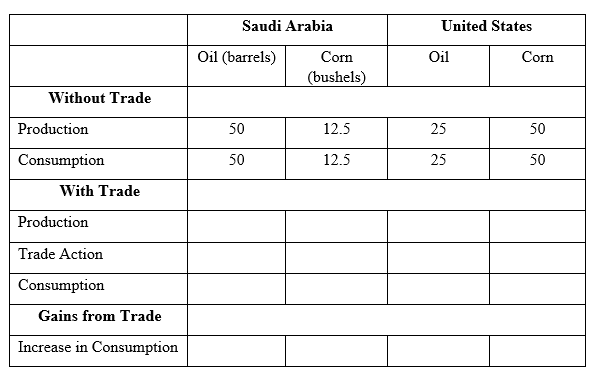
- Fill in the following table assuming complete specialization and a trade action of: Saudi Arabia trades 45 barrels of oil for 40 bushels of corn.
- The following table shows production and consumption of two countries for Lemonade and Pizza. If the terms of trade is 193 Pitchers of Lemonade to 110 pizzas, fill in the blank given by the letters if each country completely specializes in the good in which it has the applicable advantage.
- Graph the supply and demand curves using the following supply and demand schedule. Label the equilibrium price and quantity.
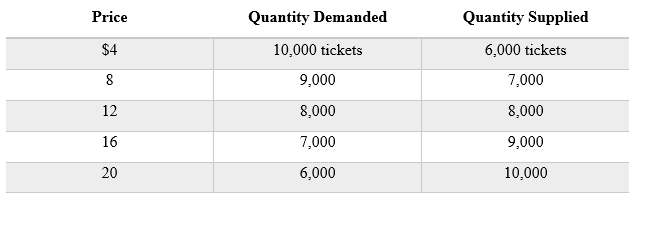
- Answer if there is shortage or surplus at each price of the good
| Price | Qd | Qs | Shortage |
|---|---|---|---|
| 4 | 10000 | 6000 | 4000 |
| 8 | 9000 | 7000 | 2000 |
| 12 | 8000 | 8000 | 0 |
| 16 | 7000 | 9000 | -2000 |
| 20 | 6000 | 10000 | -4000 |
- Effect of Shift of Demand and Supply on Eq’m Price and Quantity:
Each of the events listed below has an impact on the market for smartphones. For each event, identify which curve is affected (supply or demand or both for smartphones), the direction in which it shifts, and the resulting impact on the equilibrium price and quantity of smartphones.
- The price of tablets increases.
- Consumers’ incomes decrease, and smartphones are a normal good.
- The price of semiconductor chips used to manufacture smartphones increases.
- A new social trend increases consumers’ preference for smartphones.
- Consumers expect the price of smartphones to fall in the future.
- A technological advance in the manufacture of smartphones occurs.
- The prices of smartphone cases and wireless earbuds are reduced.
Answer Key
Demand shifts right, equilibrium price goes up, quantity goes up.
Demand shifts left, equilibrium price goes down, quantity goes down.
Supply shifts left, equilibrium price goes up, quantity goes down.
Demand shifts right, equilibrium price goes up, quantity goes up.
Demand shifts left, equilibrium price goes down, quantity goes down (currently).
Supply shifts right, equilibrium price goes down, quantity goes up.
Demand shifts right, equilibrium price goes up, quantity goes up.